UWB measurement campaign
We conducted two ultrawideband (UWB) channel measurement campaigns to obtain data for statistical UWB channel modeling. Both measurement campaigns are described in detail in a paper that was published in the IEEE Transactions on Wireless Communications, Vol. 6, No. 7, July 2007. On this website, we provide the raw measurement data from both measurement campaigns for download. Interested parties are welcome to use our measurement data for their own analyses and simulations.
We encourage you to have a look at our TWireless paper to make the most use of the measurement data provided, and to understand the terminology used in the following sections.
Please refer to the measurement database as:
UWB measurement database
U. Schuster and H. Bölcskei, ETH Zurich, Switzerland, March 2005.
Important Information
If you are thinking of contacting us, please do not e-mail the author to ask for download instructions, installation guidelines, or the measurement data itself. Note that we will NOT help to debug user-generated code not included in the provided package.The package is supplied "as is", without any accompanying support services, maintenance, or future updates. We make no warranties, explicit or implicit, that the software/measurement data contained in this package is free of error or that it will meet your requirements for any particular application. It should not be relied upon for any purpose where incorrect results could result in loss of property, personal injury, liability, or whatsoever. If you do use our software/measurement data for any such purpose, it is at your own risk. The authors disclaim all liability of any kind, either direct or consequential, resulting from your use of these programs/measurement data.
If you plan to use our measurement data, and agree with the conditions and regulations above, please contact Michael Lerjen via email for a password to download the files provided. We had to set up this precautionary measure to prevent our webserver from stalling if several downloads are attempted concurrently. Please download only one file at a time and do not use download tools that establish several simultaneous connections.
Measurement Campaign I
A channel model for wireless access point scenarios, short-range peer-to-peer systems, and other applications with mobile terminals should take the spatial variability of the channel into account. In this measurement campaign, we used a vector network analyzer (VNA) to record transfer functions of a static channel, varying the antenna position over space.
Although we only analyzed the frequency band from 2 GHz to 5 GHz in the TWireless paper, we actually measured a larger bandwidth, from 2 GHz to 8 GHz. To this end, we performed two VNA sweeps for every antenna position, one from 2 GHz to 5 GHz, and another one from 5 GHz to 8 GHz, with 1601 frequency points in each band. The Matlab arrays provided here contain the concatenated transfer functions of both bands, with a total of 3201 points and a point spacing of 1.875 MHz. Data measured over one grid with 45 antenna positions is contained in one Matlab array, where the first dimension corresponds to the frequency points, the second array dimension indexes the long dimension of the measurement grid with 9 points, and the third dimension of the array corresponds to the short array dimension, with 5 points.
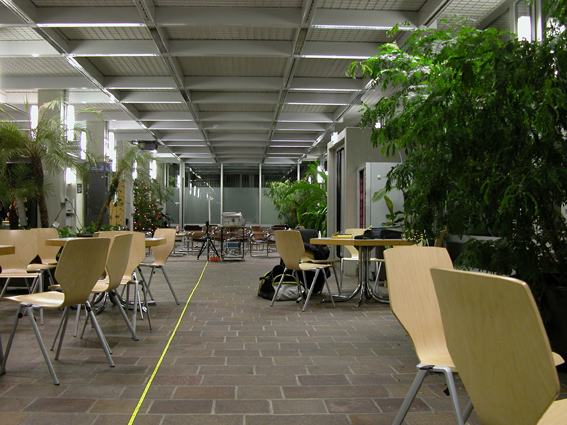
ETH Zurich, ETZ Building, Lobby
This environment is described in the TWireless paper, Section V-A, where a floor plan with all locations of transmit array and receiving antenna is provided. For a visual impression, please have a look at this photo.
- Line-of-sight (LOS) setting: etz-los-raw.mat.zip (8 MB)
- Obstructed line-of-sight (OLOS) setting: etz-olos-raw.mat.zip (4.8 MB)
- Non-line-of-sight (NLOS) setting: etz-nlos-raw.mat.zip (3.2 MB)
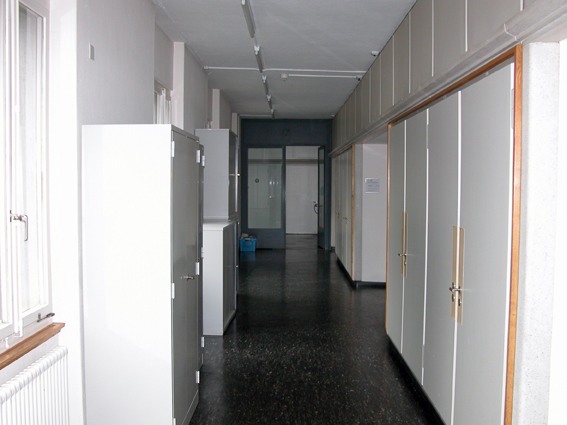
ETH Zurich, ETF Building, Corridor
This environment is not described in the TWireless paper, because of space constraints. You can have a look at the floor plan, where locations of transmitter and receiver are indicated, and get a visual impression of the corridor from this photo. The measurement methodology used in the corridor was exactly the same as in the lobby.
- Line-of-sight (LOS) setting: etf-los-raw.mat.zip (4.8 MB)
- Non-line-of-sight (NLOS) setting: etf-nlos-raw.mat.zip (1.6 MB)
Measurement Campaign II
In wireless personal area networks and wireless sensor networks, e.g. for building automation or industrial applications, the terminals are typically static, and variations in the channel are mainly caused by moving scatterers, e.g., moving persons. In this measurement campaign, we used fixed antennas and measured the channel in real time with a digital sampling oscilloscope (DSO). We conducted measurements in the lobby of the ETZ building only, as described in the TWireless paper, Section V-B. Note that these measurements result in significantly larger files. Furthermore, they are not ready for immediate use, since postprocessing is necessary.
Raw Measurement Data
We recorded 1011 snapshots in the LOS setting, 2722 snapshots in the OLOS setting, and 1256 snapshots in the NLOS setting, using port 1 (=Ch1) of the DSO. In addition to the channel snapshots, a copy of the PN sequence for the extraction of a time reference was recorded on port 2 (=Ch3). The compressed archives, available for download below, contain one file for each channel snapshot (DSO-Ch1), and one file for each reference snapshot (DSO-Ch3). The files are written in the internal binary format of the DSO, a Matlab function to read these files is provided below. Because the files are too large, we split them into two parts, for the OLOS setting even into four parts. Reassembling the pieces is possible by either using the cat utility on *nix systems (cat file.zip.* > file.zip), or the copy utility on the Windows command line (copy /b file.zip.* file.zip).
- Line-of-sight (LOS) setting: td-etz-los-raw.zip.a (1.75 GB), td-etz-los-raw.zip.b (760 MB)
- Obstructed line-of-sight (OLOS) setting: td-etz-olos-ch1-raw.zip.a (1.75 GB), td-etz-olos-ch1-raw.zip.b (1.34 GB), td-etz-olos-ch3-raw.zip.a (1.75 GB), td-etz-olos-ch3-raw.zip.b (1.54 GB)
- Non-line-of-sight (NLOS) setting: td-etz-nlos-raw.zip.a (1.75 GB), td-etz-nlos-raw.zip.b (1.39 GB)
Postprocessing
The following files are provided to enable postprocessing of the measurement data.
- The PN sequence: pnSequence.mat (1 MB)
- Two Matlab functions to read the DSO file format:readInfiniiumBin.m read2ChInfiniiumBin.m
- Calibration measurements of the system, connected back-to-back, excluding antennas: calibration.zip (242 MB)